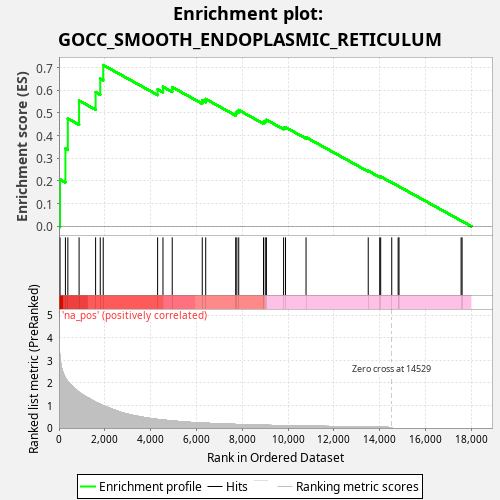
Profile of the Running ES Score & Positions of GeneSet Members on the Rank Ordered List
| Dataset | Chronic fatigue syndrome__20002-both_sexes-1482 |
| Phenotype | NoPhenotypeAvailable |
| Upregulated in class | na_pos |
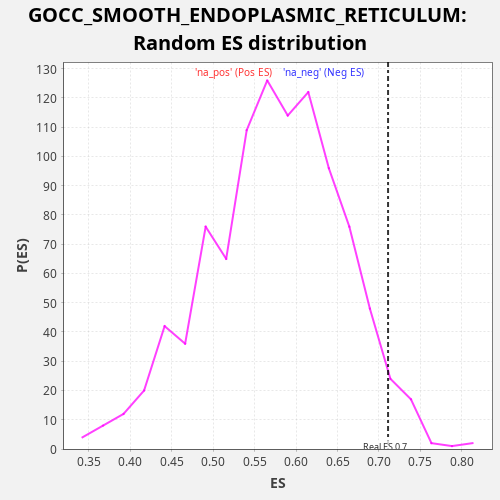
| GeneSet | GOCC_SMOOTH_ENDOPLASMIC_RETICULUM |
| Enrichment Score (ES) | 0.710936 |
| Normalized Enrichment Score (NES) | 1.2375695 |
| Nominal p-value | 0.035 |
| FDR q-value | 0.52050686 |
| FWER p-Value | 1.0 |
| SYMBOL | RANK IN GENE LIST | RANK METRIC SCORE | RUNNING ES | CORE ENRICHMENT | |
|---|---|---|---|---|---|
| 1 | STX17 | 45 | 3.104 | 0.2068 | Yes |
| 2 | GABARAP | 280 | 2.213 | 0.3429 | Yes |
| 3 | PSEN1 | 386 | 2.048 | 0.4751 | Yes |
| 4 | DMTN | 877 | 1.579 | 0.5543 | Yes |
| 5 | HSP90B1 | 1598 | 1.145 | 0.5915 | Yes |
| 6 | GBA2 | 1801 | 1.053 | 0.6512 | Yes |
| 7 | AQP8 | 1931 | 0.992 | 0.7109 | Yes |
| 8 | CASQ1 | 4305 | 0.377 | 0.6043 | No |
| 9 | TH | 4539 | 0.351 | 0.6151 | No |
| 10 | FTCD | 4943 | 0.311 | 0.6136 | No |
| 11 | SLCO1B3-SLCO1B7 | 6254 | 0.219 | 0.5555 | No |
| 12 | SVIP | 6405 | 0.210 | 0.5613 | No |
| 13 | APP | 7713 | 0.157 | 0.4991 | No |
| 14 | HSD3B2 | 7764 | 0.155 | 0.5068 | No |
| 15 | JPH4 | 7846 | 0.153 | 0.5126 | No |
| 16 | RYR3 | 8928 | 0.121 | 0.4606 | No |
| 17 | DNAJC3 | 9004 | 0.119 | 0.4645 | No |
| 18 | PPIB | 9055 | 0.118 | 0.4696 | No |
| 19 | HYOU1 | 9805 | 0.101 | 0.4347 | No |
| 20 | CALR | 9889 | 0.099 | 0.4368 | No |
| 21 | TTYH1 | 10785 | 0.083 | 0.3926 | No |
| 22 | SYVN1 | 13500 | 0.044 | 0.2445 | No |
| 23 | MYO1D | 14001 | 0.036 | 0.2191 | No |
| 24 | SLMAP | 14044 | 0.035 | 0.2192 | No |
| 25 | PGRMC1 | 14526 | 0.011 | 0.1932 | No |
| 26 | APOB | 14806 | -0.000 | 0.1777 | No |
| 27 | ERP29 | 14844 | -0.000 | 0.1756 | No |
| 28 | RYR2 | 17554 | -0.000 | 0.0249 | No |
| 29 | HSD3B1 | 17597 | -0.000 | 0.0226 | No |