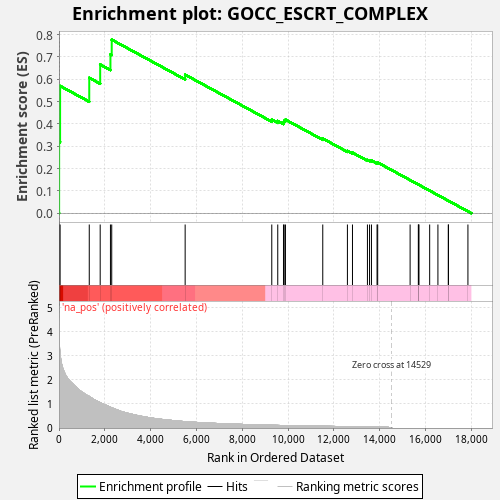
Profile of the Running ES Score & Positions of GeneSet Members on the Rank Ordered List
| Dataset | Chronic fatigue syndrome__20002-both_sexes-1482 |
| Phenotype | NoPhenotypeAvailable |
| Upregulated in class | na_pos |
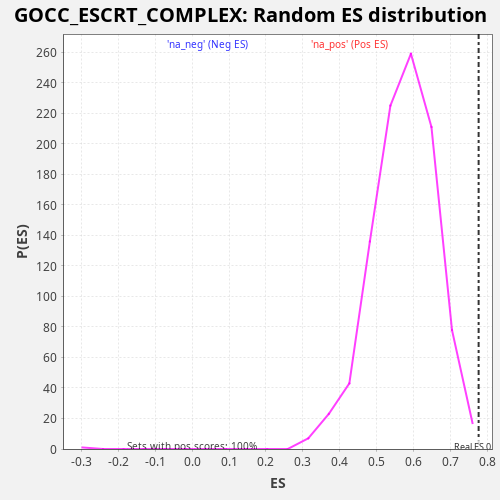
| GeneSet | GOCC_ESCRT_COMPLEX |
| Enrichment Score (ES) | 0.7770312 |
| Normalized Enrichment Score (NES) | 1.3523622 |
| Nominal p-value | 0.004004004 |
| FDR q-value | 0.23668501 |
| FWER p-Value | 0.687 |
| SYMBOL | RANK IN GENE LIST | RANK METRIC SCORE | RUNNING ES | CORE ENRICHMENT | |
|---|---|---|---|---|---|
| 1 | TSG101 | 6 | 3.922 | 0.3202 | Yes |
| 2 | SNF8 | 48 | 3.084 | 0.5699 | Yes |
| 3 | HGS | 1321 | 1.310 | 0.6062 | Yes |
| 4 | UBAP1L | 1798 | 1.054 | 0.6659 | Yes |
| 5 | CHMP4A | 2246 | 0.863 | 0.7115 | Yes |
| 6 | VPS36 | 2302 | 0.839 | 0.7770 | Yes |
| 7 | MVB12A | 5507 | 0.263 | 0.6203 | No |
| 8 | DIAPH3 | 9289 | 0.112 | 0.4190 | No |
| 9 | CHMP2B | 9550 | 0.106 | 0.4132 | No |
| 10 | STAM2 | 9800 | 0.101 | 0.4076 | No |
| 11 | VPS37B | 9830 | 0.100 | 0.4142 | No |
| 12 | MVB12B | 9886 | 0.099 | 0.4192 | No |
| 13 | CHMP4C | 11515 | 0.071 | 0.3345 | No |
| 14 | VPS37C | 12591 | 0.056 | 0.2792 | No |
| 15 | CHMP5 | 12812 | 0.053 | 0.2713 | No |
| 16 | STAM | 13465 | 0.044 | 0.2387 | No |
| 17 | VPS37A | 13557 | 0.043 | 0.2371 | No |
| 18 | CHMP7 | 13641 | 0.042 | 0.2359 | No |
| 19 | VPS28 | 13885 | 0.038 | 0.2255 | No |
| 20 | CHMP4B | 13913 | 0.038 | 0.2270 | No |
| 21 | CHMP3 | 15328 | -0.000 | 0.1484 | No |
| 22 | CHMP2A | 15687 | -0.000 | 0.1285 | No |
| 23 | CHMP1A | 15701 | -0.000 | 0.1277 | No |
| 24 | VPS25 | 15711 | -0.000 | 0.1272 | No |
| 25 | UEVLD | 16182 | -0.000 | 0.1011 | No |
| 26 | UBAP1 | 16542 | -0.000 | 0.0811 | No |
| 27 | CHMP6 | 16996 | -0.000 | 0.0559 | No |
| 28 | VPS37D | 17002 | -0.000 | 0.0556 | No |
| 29 | CHMP1B | 17852 | -0.000 | 0.0084 | No |