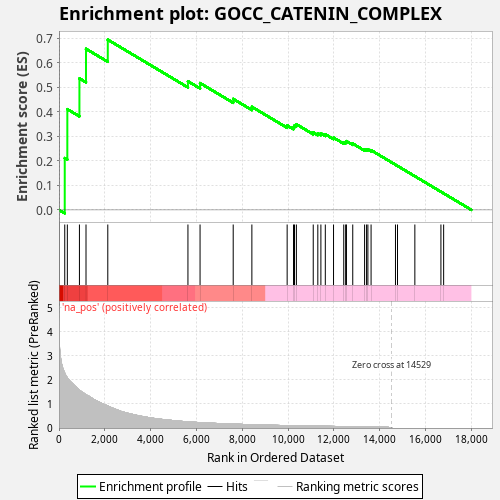
Profile of the Running ES Score & Positions of GeneSet Members on the Rank Ordered List
| Dataset | Chronic fatigue syndrome__20002-both_sexes-1482 |
| Phenotype | NoPhenotypeAvailable |
| Upregulated in class | na_pos |
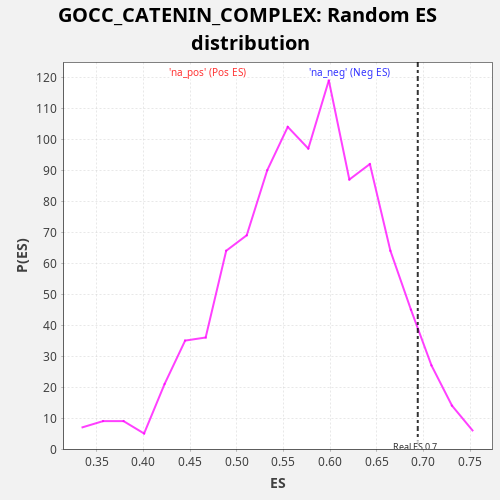
| GeneSet | GOCC_CATENIN_COMPLEX |
| Enrichment Score (ES) | 0.6938577 |
| Normalized Enrichment Score (NES) | 1.2134619 |
| Nominal p-value | 0.052 |
| FDR q-value | 0.535691 |
| FWER p-Value | 1.0 |
| SYMBOL | RANK IN GENE LIST | RANK METRIC SCORE | RUNNING ES | CORE ENRICHMENT | |
|---|---|---|---|---|---|
| 1 | DCHS1 | 251 | 2.281 | 0.2112 | Yes |
| 2 | CDH11 | 364 | 2.082 | 0.4105 | Yes |
| 3 | CDH3 | 892 | 1.567 | 0.5359 | Yes |
| 4 | APC | 1179 | 1.383 | 0.6566 | Yes |
| 5 | CDH24 | 2130 | 0.913 | 0.6939 | Yes |
| 6 | CDH23 | 5629 | 0.254 | 0.5243 | No |
| 7 | CDH5 | 6158 | 0.223 | 0.5169 | No |
| 8 | JUP | 7605 | 0.160 | 0.4523 | No |
| 9 | CTNND1 | 8420 | 0.134 | 0.4202 | No |
| 10 | CDH12 | 9960 | 0.098 | 0.3442 | No |
| 11 | CTNNA1 | 10238 | 0.093 | 0.3380 | No |
| 12 | CDH18 | 10281 | 0.092 | 0.3447 | No |
| 13 | CDH20 | 10363 | 0.091 | 0.3491 | No |
| 14 | CDH19 | 11099 | 0.077 | 0.3159 | No |
| 15 | CDH4 | 11299 | 0.075 | 0.3122 | No |
| 16 | CDHR3 | 11433 | 0.073 | 0.3120 | No |
| 17 | CDH13 | 11626 | 0.070 | 0.3082 | No |
| 18 | APC2 | 11985 | 0.064 | 0.2946 | No |
| 19 | CDH8 | 12431 | 0.058 | 0.2755 | No |
| 20 | CDH1 | 12514 | 0.057 | 0.2766 | No |
| 21 | CDH10 | 12549 | 0.056 | 0.2803 | No |
| 22 | CDH9 | 12824 | 0.053 | 0.2702 | No |
| 23 | CDH22 | 13341 | 0.046 | 0.2461 | No |
| 24 | CDH15 | 13428 | 0.045 | 0.2457 | No |
| 25 | CDH7 | 13485 | 0.044 | 0.2469 | No |
| 26 | CDH6 | 13624 | 0.042 | 0.2434 | No |
| 27 | CTNNA2 | 14689 | -0.000 | 0.1842 | No |
| 28 | CDH17 | 14778 | -0.000 | 0.1793 | No |
| 29 | CDH26 | 15535 | -0.000 | 0.1372 | No |
| 30 | CTNNB1 | 16673 | -0.000 | 0.0739 | No |
| 31 | CDH2 | 16792 | -0.000 | 0.0674 | No |